
Datasheet


www.ti.com
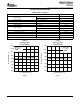
TYPICAL CHARACTERISTICS
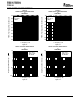
I
O
− Output Current − A
3.296
3.295
3.293
3.292
0 0.1 0.2 0.3
− Output Voltage − V
3.298
3.299
3.300
0.4 0.5 0.6
3.297
3.294
V
O
V
IN1
= 4.3 V
T
A
= 25°C
VOUT1
1.799
1.797
1.796
1.795
0 0.05 0.1 0.15
1.800
1.801
1.802
0.2 0.25 0.3
1.798
I
O
− Output Current − A
− Output Voltage − VV
O
V
IN2
= 2.8V
T
A
= 25°C
VOUT2
TPS70145, TPS70148
TPS70151, TPS70158
TPS70102
SLVS222D – DECEMBER 1999 – REVISED NOVEMBER 2004
Table 2. Table of Graphs
FIGURE
vs Output current 1 - 3
V
O
Output voltage
vs Temperature 4 - 7
Ground current vs Junction temperature 8
PSRR Power-supply rejection ratio vs Frequency 9 - 12
Output spectral noise density vs Frequency 13 - 16
Z
O
Output impedance vs Frequency 17 - 20
vs Temperature 21, 22
Dropout voltage
vs Input voltage 23, 24
Load transient response 25, 26
Line transient response 27, 28
V
O
Output voltage and enable voltage vs Time (start-up) 29, 30
Equivalent series resistance vs Output current 31 - 38
Test circuit for typical regions of stability (equivalent series resistance) performance 39
TPS70151 TPS70151
OUTPUT VOLTAGE OUTPUT VOLTAGE
vs vs
OUTPUT CURRENT OUTPUT CURRENT
Figure 1. Figure 2.
11