
Datasheet


SLVS296 − JUNE 2000
9
POST OFFICE BOX 655303 • DALLAS, TEXAS 75265
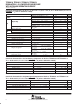
TYPICAL CHARACTERISTICS
Table of Graphs
FIGURES
Efficiency
vs Output current (TPS60210 and TPS60212) 3, 4
η Efficiency
vs Input voltage
5
I
O
Output current vs Input voltage 6
V
O
Output voltage
vs Output current (TPS60210 and TPS60212) 7, 8
V
O
Output voltage
vs Input voltage (TPS60210 and TPS60212)
9, 10
I
Q
Quiescent supply current
vs Input voltage 11
I
Q
Quiescent supply current
vs Output current in snooze mode
12
V
O
Output voltage vs Time (Exit from snooze mode) 13
V
O
Output voltage ripple
vs Time 14, 15, 16
V
O
Output voltage ripple
vs Time in snooze mode
17, 18
Load transient response 19
Line transient response 20
NOTE: All typical characteristics were measured using the typical application circuit of Figure 21 (unless otherwise noted).
Figure 3
0.1
I
O
− Output Current − mA
TPS60210
EFFICIENCY
vs
OUTPUT CURRENT
1 10 100 1000
V
I
= 2.4 V
V
I
= 1.8 V
V
I
= 2.7 V
Efficiency − %
100
90
80
70
60
50
40
30
20
10
0
Figure 4
0.1
I
O
− Output Current − mA
TPS60212
EFFICIENCY
vs
OUTPUT CURRENT
Efficiency − %
1 10 100
V
I
= 1.8 V
V
I
= 2.4 V
V
I
= 2.7 V
100
90
80
70
60
50
40
30
20
10
0