
Datasheet


SLOS327C − AUGUST 2000 − REVISED MAY 2001
5
POST OFFICE BOX 655303 • DALLAS, TEXAS 75265
electrical characteristics at specified free-air temperature, V
DD
= 5 V, T
A
= 25°C (unless otherwise
noted)
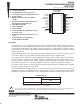
PARAMETER TEST CONDITIONS
MIN TYP MAX UNIT
|V
OS
| Output offset voltage (measured differentially) V
I
= 0 V, A
V
= 20 dB 20 mV
PSRR Power supply rejection ratio V
DD
= 4.5 V to 5.5 V 75 dB
|I
IH
| High-level input current V
DD
= 5.5 V, V
I
= V
DD
1 µA
|I
IL
| Low-level input current V
DD
= 5.5 V, V
I
= 0 V 1 µA
Z
i
Input impedance 7.5 kΩ
I
DD
Supply current BTL mode 8 12 mA
I
DD(SD)
Supply current, shutdown mode
PC-BEEP = 0 V 15 35 µA
I
DD(SD)
Supply current, shutdown mode
PC-BEEP = V
DD
/2 50 90 µA
operating characteristics, V
DD
= 5 V, T
A
= 25°C, R
L
= 4 Ω, Gain = 20 dB, BTL mode (unless otherwise
noted)
PARAMETER TEST CONDITIONS
MIN TYP MAX UNIT
P
O
Output power THD = 0.08%, f = 1 kHz 2 W
THD + N Total harmonic distortion plus noise P
O
= 1 W, f = 20 Hz to 20 kHz 0.3%
B
OM
Maximum output power bandwidth THD = 1% >20 kHz
Supply ripple rejection ratio
f = 1 kHz, C
B
= 0.47 F
BTL mode −58
dB
Supply ripple rejection ratio f = 1 kHz, C
B
= 0.47 µF
SE mode −52
dB
V
n
Noise output voltage
C
B
= 0.47 µF,
f = 20 Hz to 20 kHz,
BTL mode 29
µV
RMS
V
n
Noise output voltage
f = 20 Hz to 20 kHz,
Gain = 6 dB BTL, 0 dB SE
SE mode 23
µ
V
RMS
TYPICAL CHARACTERISTICS
Table of Graphs
FIGURE
THD+N
Total harmonic distortion plus noise
vs Output power 1, 2, 4, 6
THD+N Total harmonic distortion plus noise
vs Frequency
3, 5,
V
n
Output noise voltage vs Frequency 7
Supply ripple rejection ratio vs Frequency 8, 9
Crosstalk vs Frequency 10, 11
Shutdown attenuation vs Frequency 12
Closed loop response 13, 14
P
O
Output power vs Load resistance 15, 16
P
D
Power dissipation
vs Output power 17, 18
P
D
Power dissipation
vs Ambient temperature 19