
Datasheet


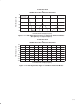


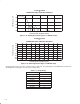

Table Of Contents
- Title Page - SLWS106H
- IMPORTANT NOTICE
- Contents
- List of Illustrations
- 1 Introduction
- 2 Specifications
- 2.1 Absolute Maximum Ratings Over Operating Free-Air Temperature Range (unless otherwise noted)†
- 2.2 Recommended Operating Conditions
- 2.3 Electrical Characteristics Over Recommended Operating Conditions, AVDD, HPVDD, BVDD = 3.3 V, DVDD = 1.5 V, Slave Mode, XTI/ MCLK = 256fs, fs = 48 kHz ( unless otherwise stated)
- 2.4 Digital-Interface Timing
- 3 How to Use the TLV320AIC23B
- Appendix A: Mechanical Data

3−13
−70
−90
0 0.5 1 1.5
−50
−10
10
2 2.5 3
−30
Filter Response − dB
Normalized Audio Sampling Frequency
FILTER RESPONSE
vs
NORMALIZED AUDIO SAMPLING FREQUENCY
Figure 3−11. ADC Digital Filter Response 0: USB Mode
(Group Delay = 12 Output Samples)
−0.04
−0.10
0 0.05 0.1 0.15 0.2 0.25 0.3
0
0.08
0.10
0.35 0.4 0.45 0.5
0.06
0.04
0.02
−0.02
−0.06
−0.08
Filter Response − dB
Normalized Audio Sampling Frequency
FILTER RESPONSE
vs
NORMALIZED AUDIO SAMPLING FREQUENCY
Figure 3−12. ADC Digital Filter Ripple 0: USB
(Group Delay = 20 Output Samples)