
Datasheet


SLOS078J − NOVEMBER 1978 − REVISED SEPTEMBER 2004
10
POST OFFICE BOX 655303 • DALLAS, TEXAS 75265
TYPICAL CHARACTERISTICS
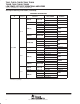
Table of Graphs
FIGURE
Maximum peak output voltage vs Supply voltage 4
Maximum peak output voltage vs Free-air temperature 5
Maximum peak output voltage vs Load resistance 6
Maximum peak output voltage vs Frequency 7
Differential voltage amplification vs Free-air temperature 8
Large-signal differential voltage amplification vs Frequency 9
Phase shift vs Frequency 9
Supply current vs Supply voltage 10
Supply current vs Free-air temperature 11
Total power dissipation vs Free-air temperature 12
Common-mode rejection ratio vs Free-air temperature 13
Normalized unity-gain bandwidth vs Free-air temperature 14
Normalized slew rate vs Free-air temperature 14
Normalized phase shift vs Free-air temperature 14
Input bias current vs Free-air temperature 15
Voltage-follower large-signal pulse response vs Time 16
Output voltage vs Elapsed time 17
Equivalent input noise voltage vs Frequency 18