
Datasheet


www.ti.com
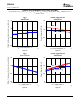
TYPICAL PERFORMANCE CURVES
ADC OUTPUT SPECTRUM (Line Input, at PGA Gain = 0 dB)
f − Frequency − kHz
−140
−120
−100
−80
−60
−40
−20
0
0 5 10 15 20
Amplitude − dB
G031
f − Frequency − kHz
−140
−120
−100
−80
−60
−40
−20
0
0 5 10 15 20
Amplitude − dB
G032
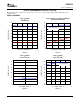
DAC OUTPUT SPECTRUM
f − Frequency − kHz
−140
−120
−100
−80
−60
−40
−20
0
0 5 10 15 20
Amplitude − dB
G033
f − Frequency − kHz
−140
−120
−100
−80
−60
−40
−20
0
0 5 10 15 20
Amplitude − dB
G034
PCM3052A
SLES160 – NOVEMBER 2005
All specifications at T
A
= 25 ° C, V
CC
1 = V
CC
2 = V
CC
3 = 5 V, V
DD
= 3.3 V, f
S
= 48 kHz, SCKI = 256 f
S
, 24-bit data, unless
otherwise noted.
OUTPUT SPECTRUM (–0.5 dB, N = 8192) OUTPUT SPECTRUM (–60 dB, N = 8192)
Figure 31. Figure 32.
OUTPUT SPECTRUM (0 dB, N = 8192) OUTPUT SPECTRUM (–60 dB, N = 8192)
Figure 33. Figure 34.
18