
Datasheet


"#$%
SBOS270C − AUGUST 2003 − REVISED AUGUST 2008
www.ti.com
18
OPA2674 HDSL2 UPSTREAM DRIVER
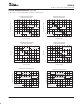
Figure 6 shows an HDSL2 implementation of a single-
supply driver.
82.5Ω
2kΩ
2kΩ
1µF
0.1µF
0.1
µ
F
11.5Ω
135
Ω
AFE
2V
PP
Max
Assumed
324Ω
20
Ω
20
Ω
324
Ω
1/2
OPA2674
1/2
OPA2674
+12V
1:2.4
17.7V
PP
I
P
= 185mA
I
P
= 185mA
11.5
Ω
+6V Z
Line
Figure 6. HDSL2 Upstream Driver
The two designs differ by the values of the matching im-
pedance, the load impedance, and the ratio turns of the
transformers. All of these differences are reflected in the
higher peak current and thus, the higher maximum power
dissipation in the output of the driver.
LINE DRIVER HEADROOM MODEL
The first step in a driver design is to compute the peak-to-
peak output voltage from the target specifications. This is
done using the following equations:
P
L
+ 10 log
V
RMS
2
(1mW) R
L
With P
L
power and V
RMS
voltage at the load, and R
L
load
impedance, this gives:
V
RMS
+ (1mW) R
L
10
P
L
10
Ǹ
V
P
+ CrestFactor V
RMS
+ CF V
RMS
with V
P
peak voltage at the load and CF Crest Factor;
V
LPP
+ 2 CF V
RMS
with V
LPP
: peak-to-peak voltage at the load.
Consolidating Equations 3 through 6 allows the required
peak-to-peak voltage at the load function of the crest fac-
tor, the load impedance, and the power in the load to be ex-
pressed. Thus:
V
LPP
+ 2 CF (1mW) R
L
10
P
L
10
Ǹ
This V
LPP
is usually computed for a nominal line imped-
ance and may be taken as a fixed design target.
The next step for the driver is to compute the individual am-
plifier output voltage and currents as a function of V
PP
on
the line and transformer turns ratio. As the turns ratio
changes, the minimum allowed supply voltage also
changes. The peak current in the amplifier is given by:
" I
P
+
1
2
2 V
LPP
n
1
4R
M
With V
LPP
defined in Equation 7 and R
M
defined in Equa-
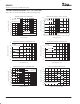
tion 2. The peak current is computed in Figure 7 by noting
that the total load is 4R
M
and that the peak current is half
of the peak-to-peak calculated using V
LPP
.
R
M
R
M
V
LPP
n
V
LPP
R
L
±
I
P
±
I
P
2V
LPP
n
1:n
Figure 7. Driver Peak Output Model
With the required output voltage and current versus turns
ratio set, an output stage headroom model will allow the re-
quired supply voltage versus turns ratio to be developed.
The headroom model (see Figure 8) can be described with
the following set of equations:
First, as available output voltage for each amplifier:
V
OPP
+ V
CC
* (V
1
) V
2
) * I
P
(R
1
) R
2
)
Or, second, as required single-supply voltage:
V
CC
+ V
OPP
) (V
1
) V
2
) ) I
P
(R
1
) R
2
)
The minimum supply voltage for a power and load require-
ment is given by Equation 10.
(3)
(4)
(5)
(6)
(7)
(8)
(9)
(10)