
Datasheet


ADC12130, ADC12132, ADC12138
www.ti.com
SNAS098G –MARCH 2000–REVISED MARCH 2013
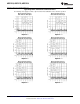
Typical Dynamic Performance Characteristics (continued)
The following curves apply for 12-bit + sign mode after Auto Calibration unless otherwise specified.
Bipolar Spurious Free Unipolar Signal-to-Noise Ratio
Dynamic Range vs. Input Frequency
Figure 36. Figure 37.
Unipolar Signal-to-Noise Unipolar Signal-to-Noise
+ Distortion Ratio + Distortion Ratio
vs. Input Frequency vs. Input Signal Level
Figure 38. Figure 39.
Unipolar Spectral Response Unipolar Spectral Response
with 1 kHz Sine Wave Input with 10 kHz Sine Wave Input
Figure 40. Figure 41.
Copyright © 2000–2013, Texas Instruments Incorporated Submit Documentation Feedback 19
Product Folder Links: ADC12130 ADC12132 ADC12138