
User Manual


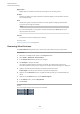


Table Of Contents
- Table of Contents
- New Features
- Introduction
- Setting up Your System
- Audio Connections
- Project Window
- Project Handling
- Tracks
- Track Handling
- Adding Tracks via the Add Track Dialog
- Adding Tracks Using Track Presets
- Adding Tracks by Dragging Files from the MediaBay
- Exporting MIDI Tracks as Standard MIDI Files
- Removing Selected Tracks
- Removing Empty Tracks
- Moving Tracks in the Track List
- Renaming Tracks
- Automatically Assigning Colors to New Tracks/Channels
- Showing Track Pictures
- Setting the Track Height
- Selecting Tracks
- Deselecting Tracks
- Duplicating Tracks
- Disabling Tracks
- Organizing Tracks in Folder Tracks
- Handling Overlapping Audio
- Track Folding Menu
- Events Display on Folder Tracks
- Modifying Event Display on Folder Tracks
- Lanes, Takes, and Overlapping Events
- Defining the Track Time Base
- Track Versions
- Track Versions Pop-Up Menu
- Track Versions Section
- Creating New Track Versions
- Track Version IDs
- Active Track Version
- Duplicating Track Versions
- Deleting Track Versions
- Copying and Pasting Selection Ranges Between Track Versions
- Copying and Pasting Selected Events between Track Versions
- Track Version Names
- Renaming a Track Version
- Renaming Track Versions on Multiple Tracks
- Track Versions vs. Lanes
- Track Presets
- Audio Track Presets
- MIDI Track Presets
- Creating a Track Preset
- Loading Presets for Tracks
- Loading Presets for VST Instruments
- Instrument Track Presets
- VST Presets
- Extracting the Sound from an Instrument Track or VST Preset
- Multi-Track Presets
- Loading Multi-Track Presets
- Sampler Track Presets
- Creating a Sampler Track Preset
- Pattern Banks
- Loading Track or VST Presets
- Loading Inserts and EQ from Track Presets
- Track Quick Control Presets
- Parts and Events
- Events
- Parts
- Editing Techniques for Parts and Events
- Auditioning Audio Parts and Events
- Scrubbing
- Selecting with the Object Selection Tool
- Combine Selection Tools Mode
- Select Submenu
- Removing Events
- Event Movement Options
- Setting Spacers between Events
- Renaming Events
- Event Resize Options
- Splitting Events
- Using Cut Head and Cut Tail
- Gluing Events
- Pasting Events
- Duplicating Events
- Repeating Events
- Fill Loop
- Moving the Contents of Events
- Grouping Events
- Locking Events
- Inverting the Phase of Audio Events
- Muting Events
- Range Editing
- Playback and Transport
- On-Screen Keyboard
- Recording
- Importing Audio and MIDI Files
- Quantizing MIDI and Audio
- Fades, Crossfades, and Envelopes
- Arranger Track
- Transpose Functions
- Markers
- MixConsole
- MixConsole in Lower Zone
- MixConsole Window
- MixConsole Left Zone
- MixConsole Toolbar
- Fader Section
- Channel Racks
- Adding Track Pictures to MixConsole Channels
- Adding Notes to a MixConsole Channel
- Applying Channel Colors to Channel Controls
- Channel Latency Overview
- Channel Settings
- Keyboard Focus in the MixConsole
- Audio Effects
- Direct Offline Processing
- Time Stretch and Pitch Shift Algorithms
- Audio Functions
- Sample Editor
- Hitpoints
- Tempo Matching Audio
- Pitch Editing and Time Correction with VariAudio
- VariAudio and Offline Processes
- VariAudio Inspector Section
- Segments and Gaps
- Sample Editor Piano Keyboard Display
- Navigating and Zooming through Segments
- Auditioning
- Smart Controls
- Segment Editing
- Selecting a Musical Scale for VariAudio Segments
- Using the Chord Track Data as Musical Scale
- Pitch Changes
- Timing Modifications
- Showing MIDI Reference Tracks
- Formant Shifting
- Editing Volume
- Functions Menu
- Harmony Voices for Audio
- Audio Part Editor
- Extensions in Cubase
- Sampler Tracks
- Pool
- Pool Window
- Working with the Pool
- Renaming Clips or Regions in the Pool
- Duplicating Clips in the Pool
- Inserting Clips into a Project
- Deleting Clips from the Pool
- Locating Events and Clips
- Searching for Audio Files
- Missing Files
- Auditioning Clips in the Pool
- Opening Clips in the Sample Editor
- Importing Media
- Exporting Regions as Audio Files
- Changing the Pool Record Folder
- Organizing Clips and Folders
- Applying Processing to Clips in the Pool
- Minimizing Files
- Converting Files
- Extracting Audio from Video File
- MediaBay and Media Rack
- Media Rack in Right Zone
- MediaBay Window
- MediaBay Toolbar
- Setting up the MediaBay
- File Browser Section
- Results Section
- Previewer Section
- Filters Section
- Attribute Inspector
- Working with the MediaBay
- Working with Volume Databases
- MediaBay Settings
- Automation
- VST Instruments
- Adding VST Instruments
- VST Instrument Control Panel
- VST Instrument Selector
- Creating Instrument Tracks
- VSTi Rack in the Right Zone
- VST Instruments Window
- VST Instruments Window Toolbar
- VST Instrument Controls
- Presets for Instruments
- Playing Back VST Instruments
- Latency
- Import and Export Options
- Side-Chaining for VST Instruments
- Installing and Managing VST Plug-ins
- Track Quick Controls
- MIDI Remote
- Remote Controlling Cubase
- MIDI Realtime Parameters and MIDI Effects
- Using MIDI Devices
- MIDI Functions
- Transpose Setup Dialog
- Merging MIDI Events into a New Part
- Dissolve Part Dialog
- Repeating MIDI Events of Independent Track Loops
- Extending MIDI Notes
- Fixing MIDI Note Lengths
- Fixing MIDI Note Velocities
- Rendering Sustain Pedal Data to Note Lengths
- Deleting Overlaps
- Editing Velocity
- Deleting Double Notes
- Deleting Controller Data
- Deleting Continuous Controller Data
- Restricting Polyphonic Voices
- Thinning Out Controller Data
- Extracting MIDI Automation
- Reversing the Playback Order of MIDI Events
- Inverting the Order of Selected MIDI Events
- MIDI Editors
- Common MIDI Editor Functions
- Changing the Ruler Display Format
- Zooming in MIDI Editors
- Using Cut and Paste
- Handling Note Events
- Handling Several MIDI Parts
- Controller Display
- Controller Lane Setup Menu
- Controller Lane Context Menu
- Controller Selection and Functions Menu
- Create Controller Lane Menu
- Adding Controller Lanes
- Displaying a Different Controller Event Type
- Setting up Available Continuous Controllers
- Saving Controller Lane Presets
- Editing Velocity Events
- Pitchbend Controller Lanes
- Adding Poly Pressure Events
- Adding Continuous Controllers
- Continuous Controllers and MIDI Automation
- Line Tool Modes
- Controller Event Editor
- Auto Select Controllers
- Moving Events in the Controller Display
- Key Editor
- Key Editor Operations
- Matching Note Events to a Musical Scale
- Inserting Note Events with the Object Selection Tool
- Deleting Note Events
- Drawing Note Events with the Draw Tool
- Modifying Note Values while Inserting Notes
- Drawing Note Events with the Line Tool
- Moving and Transposing Note Events
- Resizing Note Events
- Using the Trim Tool
- Splitting Note Events
- Gluing Note Events
- Changing the Pitch of Chords
- Changing the Voicing of Chords
- Chord Editing Section
- Inserting Chords
- Applying Chord Events to Note Events
- Drum Map Handling
- Editing Note Events via MIDI Input
- Step Input
- Score Editor
- Score Editor Operations
- Drum Editor
- Drum Editor Operations
- Drum Maps
- List Editor
- List Editor Operations
- In-Place Editor
- Common MIDI Editor Functions
- Note Expression
- VST Note Expressions
- MIDI Controllers
- Note Expression Inspector Section
- Note Expression Tools
- Controller Mapping
- Recording
- Note Expression Event Editor
- Navigation in the Note Expression Event Editor
- Adding Note Expression Events
- Deleting Note Expression Events
- Pasting Note Expression Events to Different Notes
- Pasting Note Expression Events to Different Parameters
- Repeating Note Expression Events
- Moving Note Expression Events
- Adding Release Phases to Notes
- Trimming Note Expression Data
- Removing All Note Expression Data
- Note Expression MIDI Setup Dialog
- Chord Functions
- Chord Pads
- Project Input Transformer
- Logical Editor
- Editing Tempo and Time Signature
- Rendering Audio and MIDI
- Export Audio Mixdown
- Synchronization
- VST System Link
- Video
- Exchanging Files with Other Applications
- Key Commands
- Key Commands Dialog
- Assigning Key Commands
- Searching for Key Commands
- Removing Key Commands
- Setting up Macros
- Saving Key Commands Presets
- Loading Key Command Presets
- Resetting Key Commands
- Default Key Commands
- Add Track Category
- Audio Category
- Automation Category
- Chords Category
- Devices (Studio) Category
- Direct Offline Processing Category
- Edit Category
- Editors Category
- File Category
- Media Category
- MIDI Category
- MixConsole History Category
- Navigate Category
- Nudge Category
- Project Category
- Quantize Category
- Set Insert Length Category
- Tool Category
- Track Versions Category
- Transport Category
- Window Zones Category
- Workspaces Category
- Zoom Category
- Setting up Tool Modifier Keys
- Customizing
- Optimizing Audio Performance
- Preferences
- Index

AFTER COMPLETING THIS TASK
● If you have selected more than one event and did not activate Process All Selected Events,
the Detect Silence dialog opens again after processing, allowing you to make separate
settings for the next event.
RELATED LINKS
Detect Silence Dialog on page 441
Spectrum Analyzer Window
The Spectrum Analyzer window displays the audio spectrum of an event, clip, or selection range
as a two-dimensional graph, with frequency range on the x-axis and level distribution on the
y-axis.
●
To open the Spectrum Analyzer window for a selected audio event, clip, or selection range,
select
Audio > Spectrum Analyzer.
Frequency display
Shows the frequency graphs for the analyzed audio.
If you move the mouse pointer over a certain position, the channel, frequency, note,
and level at that position are shown in the value eld at the top of the display.
Channel selector
For multi-channel audio, this pop-up menu allows you to select which channels are
shown in the frequency display.
Zoom slider
Allows you to zoom in and out horizontally.
RELATED LINKS
Analyzing the Audio Spectrum on page 446
Audio Functions
Spectrum Analyzer Window
445
Cubase Artist 12