
User's Manual


LOG DX / TDM 200
63
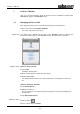
Up to four curves can be seen:
Blue … Measuring channel 1
Red … Measuring channel 2
Green … Measuring channel 3
Orange … Measuring channel 4
Hiding a curve
You can hide any of the curves in the diagram view.
► Click on the corresponding coloured rectangle under the diagram. To show it again,
tap on the same rectangle.
Zoom
You can narrow the chart view to any time range.
Option 1:
► Touch a point on the diagram and slide your finger to the side to highlight the desired
area.
Option 2:
► Slide the two control elements to the left/right at the top of the diagram.
Reset:
► Tap Show all to reset the view.
Individual values
For each individual recording in the diagram, you can find the measured value and the
exact time of the measurement.
► Touch the desired point in the diagram.
A vertical red line appears (cursor). The time of the individual recording is displayed at
the base of the line. At the intersections with each curve, the measured values can be
read.