
User guide


3
GB
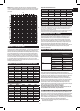
IMPORTANT: If the chart/table shows that you are outside of a ‘normal’ healthy weight
range, consult your doctor before taking any action. BMI classifications are for adults
(age 20+ years) only.
kg
m
st
ft
BODY FAT -WHAT DOES IT MEAN?
The human body is made up of, amongst other things, a percentage of fat. This is vital
for a healthy, functioning body - it cushions joints and protects vital organs, helps
regulate body temperature, stores vitamins and helps the body sustain itself when food
is scarce. However, too much body fat or indeed too little body fat can be damaging to
your health. It is dicult to gauge how much body fat we have in our bodies simply by
looking at ourselves in the mirror. This is why it is important to measure and monitor
your body fat percentage. Body fat percentage gives you a better measure of fitness
than weight alone – the composition of your weight loss could mean you are losing
muscle mass rather than fat - you could still have a high percentage of fat even when a
scale indicates ‘normal weight’.
NORMAL HEALTHY RANGE OF BODY FAT PERCENTAGE
Bod Fat %
Body Fat % Ranges for Boys*
Age Low Optimal Moderate High
10 ≤12.8 12.9 - 22.8 22.9 - 27.8 ≥27.9
11 ≤12.6 12.7 - 23.0 23.1 - 28.2 ≥28.3
12 ≤12.1 12.2 - 22.7 22.8 - 27.8 ≥27.9
13 ≤11.5 11.6 - 22.0 22.1 - 26.9 ≥27.0
14 ≤10.9 11.0 - 21.3 21.4 - 25.8 ≥25.9
15 ≤10.4 10.5 - 20.7 20.8 - 24.9 ≥25.0
16 ≤10.1 10.2 - 20.3 20.4 - 24.2 ≥24.3
17 ≤9.8 9.9 - 20.1 20.2 - 23.8 ≥23.9
18 ≤9.6 9.7 - 20.1 20.2 - 23.5 ≥23.6
Body Fat % Ranges for Girls*
Age Low Optimal Moderate High
10 ≤16.0 16.1 - 28.2 28.3 - 32.1 ≥32.2
11 ≤16.1 16.2 - 28.8 28.9 - 32.7 ≥32.8
12 ≤16.1 16.2 - 29.1 29.2 - 33.0 ≥33.1
13 ≤16.1 16.2 - 29.4 29.5 - 33.2 ≥33.3
14 ≤16.0 16.1 - 29.6 29.7 - 33.5 ≥33.6
15 ≤15.7 15.8 - 29.9 30.0 - 33.7 ≥33.8
16 ≤15.5 15.6 - 30.1 30.2 - 34.0 ≥34.1
17 ≤15.1 15.2 - 30.1 30.2 - 34.3 ≥34.4
18 ≤14.7 14.8 - 30.8 30.9 - 34.7 ≥34.8
Body Fat % Ranges for Men**
Age Low Optimal Moderate High
19 - 39 ≤8 8.1 - 19.9 20 - 24.9 ≥25
40 - 59 ≤11 11.1 - 21.9 22 - 27.9 ≥28
60+ ≤13 13.1 - 24.9 25 - 29.9 ≥30
Body Fat % Ranges for Women**
Age Low Optimal Moderate High
19 - 39 ≤21 21.1 - 32.9 33 - 38.9 ≥39
40 - 59 ≤23 23.1 - 33.9 34 - 39.9 ≥40
60+ ≤24 24.1 - 35.9 36 - 41.9 ≥42
*Source: Derived from; HD McCarthy, TJ Cole, T Fry, SA Jebb and AM Prentice: “Body fat reference curves for children”.
International Journal of Obesity (2006) 30, 598–602.
**Source: Derived from; Dympna Gallagher, Steven B Heymsfield, Moonseong Heo, Susan A Jebb, Peter R Murgatroyd,
and Yoichi Sakamoto: “Healthy percentage body fat ranges: an approach for developing guidelines based on body mass
index 1–3”. Am J Clin Nutr 2000;72:694–701.
The Body Fat % ranges published are for guidance only. Professional medical guidance should always be sought before
embarking on diet and exercise programs.
BODY WATER -WHY MEASURE IT?
Body water is the single most important component of body weight. It represents over
half of your total weight and almost two thirds of your lean body mass (predominantly
muscle). Water performs a number of important roles in the body:
All the cells in the body, whether in the skin, glands, muscles, brain or anywhere else,
can only function properly if they have enough water. Water also plays a vital part in
regulating the body’s temperature balance, particularly through perspiration.
The combination of your weight and fat measurement could appear to be ‘normal’ but
your body hydration level could be insucient for healthy living.
NORMAL HEALTHY RANGE OF BODYWATER PERCENTAGE
Body Water Chart***
BF % Range Optimal BW % Range
Men
4 to 14% 70 to 63%
15 to 21% 63 to 57%
22 to 24% 57 to 55%
25 and over 55 to 37%
Women
4 to 20% 70 to 58%
21 to 29% 58 to 52 %
30 to 32 % 52 to 49%
33 and over 49 to 37%
***Source: Derived from Wang & Deurenberg: “Hydration of fat-free body mass”.
American Journal Clin Nutr 1999, 69 833-841.
For those using Athlete Mode: note that athletes may have a lower body fat range and a
higher body water range than shown above, depending on their type of sport or activity.
Body water measurement results are influenced by the proportion of body fat and
muscle. If the proportion of body fat is high, or the proportion of muscle is low then the
body water results will tend to be low. It is important to remember that measurements
such as body weight, body fat and body water are tools for you to use as part of your
healthy lifestyle. As short term fluctuations are normal, we suggest you chart your
progress over time, rather than focus on a single days reading.
The Body Water % ranges published are for guidance only. Professional medical
guidance should always be sought before embarking on diet and exercise
programmes.
WHY SHOULD I KNOW MY MUSCLE MASS?
According to the American College of Sports Medicine (ASCM), lean muscle mass may
decrease by nearly 50 percent between the ages of 20 and 90. If you don’t do anything to
replace that loss you’re losing muscle and increasing fat. It is also important to know
your muscle mass % during weight reduction. At rest, the body burns approximately 110
additional calories for each kilo of muscle gained. Some advantages of gaining muscle
mass include:
• Reversingthedeclineinstrength,bonedensityandmusclemassthataccompaniesage
• Maintenanceofexiblejoints
• Guideweightreductionwhencombinedwithahealthydiet.
This product is for domestic use only. Pregnant women should only use the weight function.
CAUTION : Do not use this product if you have a pacemaker or other medical device
fitted. If in doubt, consult your doctor.