
User's Manual


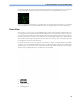


Table Of Contents
- Introduction
- Introducing the Monitor
- Devices for Acquiring Measurements
- WARNING
- Flexible Module Rack (M8048A)
- Measurement Modules
- X1 Multi-Measurement Module (M3001A)
- X1 Connectors and Symbols
- 1 White ECG/Resp connector
- 2 Blue SpO2 connector
- 3 Red NBP connector
- 4 Combined pressure (red) and temperature (brown) connector - connect either invasive pressure transducer or temperature probe. You might have a version of the MMS that does not have this connector.
- 5 NBP STAT key - starts NBP STAT series of measurements OR Zero key - initiates a zero procedure for the connected pressure transducer when pressed and held for a second
- 6 NBP Start/Stop key - starts or stops NBP measurements
- 7 Silence: acknowledges all active alarms by switching off audible alarm indicators and lamps
- X1 Connectors and Symbols
- X2 Multi-Measurement Module (M3002A)
- X2 Overview
- 1 On/Standby switch
- 2 Power and battery indicators (see “X2 Controls and Indicators” on page 18)
- 3 3.5-inch TFT LCD touchscreen QVGA display
- 4 Alarm lamps (see “X2 Controls and Indicators” on page 18)
- 5 Battery eject button
- 6 Hard keys (see “X2 Controls and Indicators” on page 18)
- 7 Measurement connectors (see “X2 Patient Connectors, Right Side” on page 19)
- 8 Battery compartment
- X2 Controls and Indicators
- 1 External power LED. Green when monitor is powered from an external power source.
- 2 Battery status LED. Yellow when charging. Flashing red when battery is empty.
- 3 On/Standby LED. Green when monitor is on. Red indicates an error.
- 4 On/Standby switch. Disabled when X2 is connected to a host monitor
- 5 Main Screen key: closes all open menus/windows and returns to the main screen.
- 6 SmartKeys key: brings up SmartKeys on the screen.
- 7 Alarms key: turns alarms On/Off, or pauses them.
- 8 Silence key
- 9 Active alarm lamp. Red or yellow, depending on alarm level. Blinks until active alarm is acknowledged.
- 10 Active INOP alarm lamp in light blue. Blinks until active INOP is acknowledged.
- 11 Alarms off indicator. When alarms are suspended, the lamp is red, and the alarms off symbol is shown.
- X2 Patient Connectors, Right Side
- X2 Left Side
- X2 Overview
- MMS Extensions
- WARNING
- M3014A, M3015A, M3015B and M3016A Capnography MMS Extensions
- 1 Pressure connectors (red)
- 2 Temperature connector (brown)
- 3 Mainstream/sidestream connector CO2
- 4 Cardiac Output connector
- 1 Pressure connectors (red) - M3015A optional
- 2 Temperature connector (brown) - M3015A optional
- 3 Inlet
- 4 Microstream connector CO2
- 5 Gas sample outlet
- 1 Pressure connectors (red)
- 2 Temperature connector (brown)
- 3 Mainstream/sidestream connector CO2 (optional)
- M3012A Hemodynamic MMS Extension
- Operating and Navigating
- Operating Modes
- Understanding Screens
- Connecting Additional Displays to the Monitor
- 1 Move the highlight to the Main Screen key and then turn one click further.
- 2 Press the navigation knob on the remote control to confirm; the highlighting will automatically move to the other display.
- 1 Select Profiles in the monitor info line of the first display,
- 2 Select Display 1, or Display 2, then select the Screen you want to appear on that display from the list of available Screens.
- Using the XDS Remote Display
- Using the Visitor Screen
- Understanding Profiles
- Understanding Settings
- Changing Wave Speeds
- Freezing Waves
- Entering Measurements Manually
- 1 Select the Enter Values SmartKey or select Main Setup then select Enter MeasValues.
- 2 Select the measurement you want to enter values for. The Edit window will open.
- 3 If the measurement is switched off, switch it on by selecting the label.
- 4 Select Value and enter the value.
- 5 Select Date/Time to enter the date and time for the value. The default is always the current date and time.
- 6 For compound labels, for example ABPs, ABPd and ABPm, select the Format field to select whether all values are required or a single value.
- 7 Select Save.
- Switching Manually Entered Measurements On and Off
- Changing Monitor Settings
- Adjusting the Screen Brightness
- Setting the Date and Time
- 1 Select the Date, Time screen element from the monitor's info line to enter the Date, Time menu.
- 2 Select, in turn, the Year, Month, Day, Hour (in 24 hour format, only) and Minute as necessary. Select the correct values from the pop-up list.
- 3 Select Store Date, Time to change the date and time.
- WARNING
- Checking Your Monitor Revision
- Getting Started
- Inspecting the Monitor
- WARNING
- 1 Before you start to make measurements, carry out the following checks on the monitor including all connected MMSs, modules, or MMS extensions.
- 2 Plug the power cord into the AC power source.
- 3 Check all the functions of the instrument that you need to monitor the patient, and ensure that the instrument is in good working order.
- WARNING
- Switching On
- Power On/Power Off Behavior
- Setting up the Modules
- Starting Monitoring
- 1 Admit your patient to the monitor.
- 2 Check that the profile, alarm limits, alarm and QRS volumes, patient category and paced status and so forth are appropriate for your patient. Change them if necessary.
- 3 Refer to the appropriate measurement chapter for further details of how to perform the measurements you require.
- WARNING
- Inspecting the Monitor
- Disconnecting from Power
- Networked Monitoring
- Using the Integrated PC
- Using the X2 or MP5 with a Host Monitor
- Alarms
- Visual Alarm Indicators
- Audible Alarm Indicators
- Acknowledging Alarms
- Pausing or Switching Off Alarms
- Alarm Limits
- WARNING
- Viewing Individual Alarm Limits
- Viewing All Alarm Limits
- Changing Alarm Limits
- 1 In the measurement's setup menu, select the alarm limit you want to change. This calls up a list of available values for the alarm limit.
- 2 Select a value from the list to adjust the alarm limit.
- 1 Enter the Alarm Limits window.
- 2 Using touch: to set the high alarm limit, select the high yellow alarm field to open a pop-up list of high alarm limits. Select a limit from the list. Repeat to set the low yellow alarm field.
- About Automatic Alarm Limits
- About Smart Alarm Delays
- Documenting Alarm Limits
- Reviewing Alarms
- Latching Alarms
- Testing Alarms
- Alarm Behavior at Power On
- Alarm Recordings
- 1 Press the Main Setup SmartKey.
- 2 Select Alarms from the Main Setup menu.
- 3 Select Alarm Recording from the Alarms menu to open the Alarm Recordings menu.
- 4 Select a measurement from those listed for which you want to change the alarm condition that triggers an alarm recording. This opens a pop-up list.
- 5 For the desired measurement(s), choose the alarm condition to trigger an alarm recording:
- Patient Alarms and INOPs
- Patient Alarm Messages
- Technical Alarm Messages (INOPs)
- Monitor INOPs
- Battery INOPs
- MMS, MMS Extensions and FMS INOPs
- Display INOPs
- ECG, Arrhythmia, QT and ST INOPs
- Pulse INOPs
- Resp INOPs
- NBP INOPs
- Temperature INOPs
- SpO2 INOPs
- Pressure INOPs
- CO2 INOPs
- SO2 INOPs
- C.O. INOPs
- tcGas INOPs
- EEG INOPs
- BIS INOPs
- Spirometry INOPs
- VueLink INOPs
- IntelliBridge INOPs
- Telemetry INOPs
- ProtocolWatch INOPs
- Calculated Values INOPs
- Cableless Measurement Device INOPs
- Managing Patients
- Admitting a Patient
- NOTE
- 1 Select the patient name field or select the Admit/Dischrg SmartKey to open the Patient Demographics window.
- 2 Clear any previous patient data by selecting the Dischrge Patient or End Case pop-up key and then Confirm.
- 3 Select Admit Patient.
- 4 Enter the patient information: select each field and use the on-screen keyboard or choose from the pop-up list of alternatives to input information.
- Patient Category and Paced Status
- Admitting a Centrally-Monitored Patient
- NOTE
- Quick Admitting a Patient
- 1 Select the Quick Admit SmartKey.
- 2 Enter the required data (ID fields or last name depending on configuration) with the keyboard or a barcode scanner.
- 3 Select Enter.
- 4 In the confirmation window, select Confirm to discharge the previous patient (if confirmation is configured).
- 5 Check that patient category and paced status are correct for the new patient.
- Editing Patient Information
- Discharging a Patient
- Transferring Patients
- WARNING
- Transferring a Centrally-Monitored Patient
- 1 Before you disconnect the MMS from the monitor, select the patient name field or select the Admit/ Dischrge SmartKey to open the Patient Demographics window, then select the Transfer pop-up key. If the patient is not admitted or not monitored by an...
- 2 Remove the MMS and any connected extensions from the monitor.
- 3 Connect the MMS to the transfer monitor and monitor your patient during the move.
- 4 At the new location, connect the MMS to the monitor. If the monitor detects a patient mismatch, a window will open showing your patient's data and asking whether to Complete Transfer Of This Patient?.
- 5 Select Yes to complete the transfer. This re-admits the patient from the transfer list to the new monitor. This will upload the patient demographics, and, if configured, the measurement settings and trend data stored in the MMS to the receiving mon...
- 6 Verify that the settings for patient category and paced mode are correct.
- Transferring a Centrally-Monitored Patient with X2 or MP5
- WARNING
- 1 Before you disconnect the X2/MP5 from the host monitor, select the patient name field or select the Admit/ Dischrge SmartKey to open the Patient Demographics window, then select the Transfer pop-up key. If the patient is not admitted or not monitor...
- 2 Remove the X2/MP5 and any connected extensions from the monitor.
- 3 Move the patient using the X2/MP5 as the transport monitor.
- 4 At the new location, connect the X2/MP5 to the new host monitor. If the monitor detects a patient mismatch, a window will open showing your patient's data and asking Complete Transfer Of This Patient?.
- 5 Select Yes to complete the transfer. This re-admits the patient from the transfer list to the new monitor. This will upload the patient demographics, and, if configured, the measurement settings and trend data stored in the X2/MP5 to the receiving ...
- 6 Verify that the settings for patient category and paced mode are correct.
- WARNING
- Transferring a Centrally-Monitored Patient with X2 or MP5 using IIT
- WARNING
- NOTE
- 1 Remove the X2/MP5 and any connected extensions from the host monitor.
- 2 Move the patient using the X2/MP5 as the transport monitor.
- 3 At the new location, just before connecting the X2/MP5 to the new host monitor:
- 4 Connect the X2/MP5 to the new host monitor. The monitor detects a patient mismatch and a window will open showing your patient's data and asking Complete Transfer Of This Patient?.
- 5 Select Yes to complete the transfer. This re-admits the patient from the transfer list to the new monitor. This will upload the patient demographics, and, if configured, the measurement settings and trend data stored in the X2/MP5 to the receiving ...
- 6 Verify that the settings for patient category and paced mode are correct.
- Transferring a Patient with an X1 (no Information Center)
- 1 Disconnect the X1 from the original monitor and silence the resulting UNPLUGGED INOP.
- 2 Connect the X1 to the transport monitor and move the patient.
- 3 At the new monitoring location, remove the X1 from the transport monitor and connect it to the new monitor.
- 4 If prompted, re-admit the patient to the new monitor: in the Select Patient window, select the patient in the X1 to retain the data in the X1. This will upload the patient demographics, and, if configured, the measurement settings and trend data st...
- Transferring a Patient with an X2 or MP5 (no Information Center)
- WARNING
- 1 Disconnect the X2/MP5 from the original host monitor and silence the resulting UNPLUGGED INOP.
- 2 Move the patient using the X2/MP5 as the transport monitor.
- 3 At the new monitoring location, connect the X2/MP5 to the new host monitor.
- 4 If prompted, re-admit the patient to the new monitor: in the Select Patient window of the new monitor, select the patient in the X2/MP5 to retain the data in the X2/MP5. This will upload the patient demographics, and, if configured, the measurement...
- WARNING
- Data Upload from an MMS
- Data Exchange Between Information Centers
- Resolving Patient Information Mismatch
- WARNING
- 1 When a monitor is connected to an Information Center by the wireless IntelliVue Instrument Telemetry interface, the patient data will automatically be merged in the case of a transfer. This means there is no patient discharge at the monitor and set...
- 2 It is important to resolve the mismatches as soon as they are identified. Failure to do so could result in using incorrect/confusing data to make clinical decisions. Certain settings, for example Paced and Patient Cat., may not match between the In...
- WARNING
- Manually Resolving Patient Mismatch
- Automatically Resolving Patient Mismatch
- Care Groups
- Admitting a Patient
- ECG, Arrhythmia, ST and QT Monitoring
- Skin Preparation for Electrode Placement
- 1 Select sites with intact skin, without impairment of any kind.
- 2 Clip or shave hair from sites as necessary.
- 3 Wash sites thoroughly with soap and water, leaving no soap residue.
- 4 Dry skin thoroughly.
- 5 Gently abrade the skin using ECG skin preparation paper to remove dead skin cells to improve the conductivity of the electrode site.
- Connecting ECG Cables
- 1 Attach the clips or snaps to the electrodes before placing them. If you are not using pre-gelled electrodes, apply electrode gel to the electrodes before placement.
- 2 Place the electrodes on the patient according to the lead placement you have chosen.
- 3 Attach the electrode cable to the patient cable.
- 4 Plug the patient cable into the white ECG connector. An ECG waveform and numeric appears on the monitor display.
- CAUTION
- Selecting the Primary and Secondary ECG Leads
- Checking Paced Status
- Understanding the ECG Display
- Monitoring Paced Patients
- Changing the Size of the ECG Wave
- Changing the Volume of the QRS Tone
- Changing the ECG Filter Settings
- Selecting Positions of Va and Vb Chest Leads (for 6-lead placement)
- Choosing EASI or Standard Lead Placement
- About ECG Leads
- ECG Lead Fallback
- ECG Lead Placements
- Standard 3-Lead Placement
- Standard 5-Lead Placement
- 1 RA placement: directly below the clavicle and near the right shoulder
- 2 LA placement: directly below the clavicle and near the left shoulder
- 3 RL placement: on the right lower abdomen
- 4 LL placement: on the left lower abdomen
- 5 V placement: on the chest, the position depends on your required lead selection
- 6-Lead Placement
- Chest Electrode Placement
- 1 Locate the second intercostal space by first palpating the Angle of Lewis (the little bony protuberance where the body of the sternum joins the manubrium). This rise in the sternum is where the second rib is attached, and the space just below this ...
- 2 Palpate and count down the chest until you locate the fourth intercostal space.
- 10-Lead Placement
- Conventional 12-Lead ECG
- Choosing Standard or Modified Electrode Placement
- Capture 12-Lead
- EASI ECG Lead Placement
- WARNING
- EASI Electrode Placement
- 1 E (V) - on the lower sternum at the level of the fifth intercostal space
- 2 A (LL) - on the left midaxillary line at the same level as the E electrode
- 3 S (LA) - on the upper sternum
- 4 I (RA) - on the right midaxillary line at the same level as the E electrode
- 5 N - reference electrode - can be anywhere, usually below the sixth rib on the right hip
- ECG and Arrhythmia Alarm Overview
- Using ECG Alarms
- ECG Safety Information
- About Arrhythmia Monitoring
- Switching Arrhythmia Analysis On and Off
- Choosing an ECG Lead for Arrhythmia Monitoring
- Understanding the Arrhythmia Display
- Arrhythmia Relearning
- Arrhythmia Alarms
- About ST Monitoring
- Switching ST On and Off
- Selecting Leads for ST Analysis
- 1 Enter the Setup ST Analysis menu.
- 2 Select Setup ST Leads. This opens the Setup ST Leads pop-up window. Leads chosen for ST monitoring are listed here. There are two pop-up keys at the bottom of the screen, Add and Delete. If all leads are already selected, the Add pop-up key is disa...
- 1 Select the Add key at the bottom of the Setup ST Leads window. This opens the Choices pop-up window.
- 2 Choose a lead from the list for ST monitoring. This closes the Choices window and adds the selected lead to the list of chosen leads.
- 1 Choose a lead from the list in the Setup ST Leads window.
- 2 Select the Delete key. This removes this lead from the list.
- NOTE
- Selecting Leads for ST Analysis
- Understanding the ST Display
- Updating ST Baseline Snippets
- Recording ST Segments
- About the ST Measurement Points
- CAUTION
- Adjusting ST Measurement Points
- 1 In the Setup ST Analysis menu, select Adjust ST Points to open the Adjust ST Points window. Alternatively, you can use the Adjust ST Points pop-up key in the ST Baseline window.
- 2 Select a suitable ECG lead for ST measurement, with a visible J-point and a visible P wave. Use the up and down arrow keys to scroll through the ST snippets for the other ECG leads.
- 3 Use the Select Point pop-up key to scroll through the points and activate the point you need to adjust, then use the left and right arrow keys to move the measurement point. Each point is highlighted while active.
- 4 Select the Apply Changes pop-up key to activate the new ST measurement points and recalculate all ST values.
- 5 To update the ST snippet shown in the Adjust ST Points window, select the Update pop-up key.
- ST Alarms
- Viewing ST Maps
- About QT/QTc Interval Monitoring
- QT Alarms
- Switching QT Monitoring On and Off
- Skin Preparation for Electrode Placement
- Monitoring Pulse Rate
- Entering the Setup Pulse Menu
- System Pulse Source
- 1 In the Setup Pulse menu, select System Pulse.
- 2 Select one of the SpO2 or arterial pressure labels from the pop-up list, or select Auto. If you select Auto, the monitor automatically chooses a pulse rate to be used as system pulse. It looks through the list from top to bottom and activates the f...
- Switching Pulse On and Off
- Using Pulse Alarms
- Monitoring Respiration Rate (Resp)
- Monitoring SpO2
- SpO2 Sensors
- Applying the Sensor
- 1 Follow the SpO2 sensor's instructions for use, adhering to all warnings and cautions.
- 2 Remove colored nail polish from the application site.
- 3 Apply the sensor to the patient. The application site should match the sensor size so that the sensor can neither fall off, nor apply excessive pressure.
- 4 Check that the light emitter and the photodetector are directly opposite each other. All light from the emitter must pass through the patient's tissue.
- WARNING
- Connecting SpO2 Cables
- Measuring SpO2
- SpO2 Signal Quality Indicator (Fast SpO2 only)
- Assessing a Suspicious SpO2 Reading
- Changing the Averaging Time
- Understanding SpO2 Alarms
- Pleth Wave
- Perfusion Numeric
- Perfusion Change Indicator
- Setting SpO2/Pleth as Pulse Source
- Setting Up Tone Modulation
- Setting the QRS Volume
- Calculating SpO2 Difference
- Monitoring NBP
- Introducing the Oscillometric NBP Measurement
- Preparing to Measure NBP
- 1 Connect the cuff to the air tubing.
- 2 Plug the air tubing into the red NBP connector. Avoid compression or restriction of pressure tubes. Air must pass unrestricted through the tubing.
- 3 Make sure that you are using a Philips-approved correct sized cuff and that the bladder inside the cover is not folded or twisted.
- 4 Apply the cuff to a limb at the same level as the heart. If it is not, you must use the measurement correction formula to correct the measurement.
- Correcting the Measurement if Limb is not at Heart Level
- Understanding the NBP Numerics
- Starting and Stopping Measurements
- Enabling Automatic Mode and Setting Repetition Time
- Enabling Sequence Mode and Setting Up The Sequence
- 1 In the Setup NBP menu, select Mode and select Sequence from the pop-up menu.
- 2 Select Setup Sequence to open the Setup Sequence window.
- 3 Select each sequence in turn and select the number of measurements and the time interval between the measurements.
- 4 To have measurements continue after the sequence, set the number of measurements for your last cycle to Continuous and this cycle will run indefinitely.
- CAUTION
- Choosing the NBP Alarm Source
- Switching Pulse from NBP On/Off
- Assisting Venous Puncture
- Calibrating NBP
- Monitoring Temperature
- WARNING
- Making a Temp Measurement
- 1 Select the correct type and size of probe for your patient.
- 2 If you are using a disposable probe, connect the probe to the temperature cable.
- 3 Plug the probe or temperature cable into the temperature connector socket.
- 4 Apply the probe to the patient. You are advised to use a protective rubber cover on rectal probes.
- 5 Select an appropriate temperature label.
- 6 Check that the alarm settings (on or off, high and low limits) are appropriate for this patient and this type of temperature measurement.
- WARNING
- Selecting a Temperature for Monitoring
- Extended Temperature Label Set
- Calculating Temp Difference
- Monitoring Invasive Pressure
- WARNING
- CAUTION
- Setting up the Pressure Measurement
- 1 Plug in the pressure cable.
- 2 Prepare the flush solution.
- 3 Flush the system to exhaust all air from the tubing. Ensure that the transducer and stopcocks are free of air bubbles.
- WARNING
- 1 Connect the pressure line to the patient catheter.
- 2 If you are using an infusion pressure cuff with the pressure line, attach the pressure cuff to the fluid to be infused. Inflate it according to your standard hospital procedure, then start the infusion.
- 3 Position the transducer so that it is level with the heart, approximately at the level of the midaxillary line.
- WARNING
- Selecting a Pressure for Monitoring
- Extended Pressure Label Set
- Zeroing the Pressure Transducer
- Zeroing ICP (or IC1/IC2)
- Determining a Pressure's Most Recent Zero
- Zeroing a Pressure Measurement
- WARNING
- 1 Turn off the stopcock to the patient.
- 2 Vent the transducer to atmospheric pressure, to compensate for the static and atmospheric pressure exerted on the transducer.
- 3 In the setup menu for the pressure, select Zero
. - 4 When you see the message
zero done at on the status line, close the stopcock to atmospheric pressure, and open the stopcock to the patient.
- CAUTION
- WARNING
- Using the Zero Hardkey
- Zeroing All Pressures Simultaneously
- Troubleshooting the Zero
- Adjusting the Calibration Factor
- Displaying a Mean Pressure Value Only
- Changing the Pressure Wave Scale
- Optimizing the Waveform
- Using the Wave Cursor
- Non-Physiological Artifact Suppression
- Choosing the Pressure Alarm Source
- Calibrating Reusable Transducer CPJ840J6
- Making the Pressure Calibration
- WARNING
- 1 Zero the transducer.
- 2 Connect the syringe and manometer.
- 3 Move the syringe barrel in and raise the mercury to 200 mmHg (30 kPa). 200 mmHg is the recommended calibration pressure.
- 4 In the Setup
menu, select Cal. Press. - 5 Select the calibration pressure from the list, for example 200 mmHg.
- 6 Select Confirm to recalculate the calibration factor using the applied pressure.
- 7 When the monitor displays
mercury calibr. done at , remove the manometer tubing, syringe and extra stopcock. We recommend you replace the transducer dome and tubing with sterile ones. - 8 Label the transducer with the calibration factor shown in the Cal. Factor field in the pressure's setup menu.
- 9 Reconnect the patient and start measuring again.
- WARNING
- Troubleshooting the Pressure Calibration
- Making the Pressure Calibration
- Calculating Cerebral Perfusion
- Calculating Pulse Pressure Variation
- Measuring Pulmonary Artery Wedge Pressure
- WARNING
- 1 In the Main Setup menu, select Wedge to display the wedge procedure window.
- 2 Prepare and check the pressure line according to your hospital policy.
- 3 Use the Refernce Wave 1 and Refernce Wave 2 pop-up keys to select any ECG or respiratory wave as reference waves.
- 4 Select Change Speed if you want to change the speed of the displayed wave. The speed can also be changed in the screen for editing the wedge.
- 5 Select Change Scale to change the wave scale of the PAP. The same scale will be used in the screen for editing the wedge. If the setting Optimum Scale is used, the wave scale will be optimized when a wedging waveform is recognized and will revert t...
- 6 Inflate the balloon when the monitor prompts you: Ready for balloon inflation. The waveform changes from the PAP to the PAWP wave. The measurement takes approximately 12 seconds. On completion, the monitor stores the PAWP waveform display and promp...
- 7 Deflate the balloon when the monitor prompts you: Ready for balloon deflation and verify that the waveform returns to pulmonary artery shape.
- 8 If you need to start a new measurement, select Restart Wedge.
- WARNING
- Editing the Wedge
- 1 Select the Edit Wedge pop-up key to see the stored waveforms.
- 2 The monitor displays a cursor in the waveform at the PAWP mean value. It also displays any previously stored value and the time it was stored.
- 3 Select Change Speed if you want to change the speed (resolution) of the displayed wave.
- 4 Move the cursors up, down, right and left to set them on the correct wedge position.
- 5 Select Store Wedge to store the PAWP value.
- 6 Select Print Wedge to print the PAWP waveform and any reference waves or Record Wedge to record them. While recording or printing, you cannot perform any more Wedge tasks.
- WARNING
- Identifying the Pressure Analog Output Connector
- Monitoring Cardiac Output
- Hemodynamic Parameters
- Using the C.O.Procedure Window
- 1 Average - column of averaged values
- 2 Unit column
- 3 Continuously measured numeric
- 4 Prompt message field
- 5 Thermodilution curve of current trial
- 6 Curve alert message field
- 7 Current trial number
- 8 Setup information
- 9 Trial numbers for the trial curves
- 10 Trial curves
- 11 Results table of current trial
- 12 Trial curve scale
- Accessing the Setup C.O. and Setup CCO Menus
- Entering the HemoCalc Window
- Measuring C. O. Using the PiCCO Method
- Measuring Continuous Cardiac Output
- Measuring Systemic Vascular Resistance
- Measuring Pulse Pressure Variation
- Setting Up the PiCCO C.O. Measurement
- 1 Set up the arterial line using the arterial catheter (transpulmonary catheter) and the transducer kit from PULSION Medical Systems. It must be placed in one of the bigger systemic arteries, for example, the femoral or the axillary artery. You must ...
- 2 Set up the central venous line.
- 3 Connect the injectate temperature probe housing to the venous line.
- 4 Plug the C.O. interface cable into the C.O. module or measurement extension module and connect the following devices to the C.O. interface cable:
- 5 If you are measuring CCO, set up the pressure measurement now. The CCO measurement requires a minimally dampened invasive pressure setup. You must ensure that there are no air bubbles in the pressure line or dome and use only specified accessories.
- 6 Check that the correct measurement method is selected.
- 7 Check that you are using the correct probe - the M1646. This is the only probe supported for use; it can be used with room temperature injectate or with cold injectate.
- 8 Check that the correct arterial catheter constant is selected.
- 9 Make sure that the injectate volume setting matches the injectate volume you will use. To change the volume, in the procedure window, select InjVol and select the correct injectate volume from the pop-up list.
- 10 If you are measuring CCO or CCI, check that the correct pressure source is selected in the Setup CCO menu. The pressure label under CCO From must match the pressure measured with the arterial catheter. To change the pressure source, select CCO Fro...
- 11 If you are measuring CCO or CCI, verify that the correct alarm source is selected in the menu item Alarms From. To change the alarm source, select Alarms From and choose either CCO or CCI.
- Performing PiCCO C.O. Measurements
- 1 Enter the procedure window.
- 2 When you see the message Ready for new measurement, start the measurement by selecting the pop-up key Start C.O. or pressing the Start hardkey on the C.O. module, or pressing the remote start switch. If the measuring mode is set to Auto the Start C...
- 3 When you hear the ready tone and see the message Stable baseline, inject now!, inject the solution into the CVP catheter.
- 4 When you see the Stable baseline, inject now! message, repeat the procedure until you have completed the measurements you want to perform. You can perform a maximum of 6 measurements before editing. If you perform more than 6 measurements without r...
- Editing PiCCO C.O. Measurements
- 1 Review the trials. Irregular trials or trials marked with a "?" should be reviewed carefully. Consider the similarity of the values and the shape of the C.O. curve. A normal C.O. curve has one smooth peak and returns to the temperature baseline lev...
- 2 Reject unsatisfactory trials: use the Select Trial pop-up key to move between trials, then select the Accept Reject pop-up key to accept or reject trials. If you are using a touch screen you can accept or reject trials directly by tipping on the tr...
- Saving and Calibrating PiCCO C.O. Measurements
- CCO Calibration Status Indicators
- Measuring C.O. Using the Right Heart Thermodilution Method
- Setting up RH C.O. Measurements
- 1 Set up the PA line using a PA catheter.
- 2 Attach the injectate temperature probe housing to the PA line.
- 3 Plug the C.O. interface cable into the C.O. module or measurement extension module and connect the following devices into the C.O. interface cable:
- 4 Plug the thermistor connection cable of the PA catheter into the thermistor connector.
- 5 Connect the injectate temperature probe to the injectate temperature probe housing.
- 6 Check that the correct measurement method is selected.
- Ice-Bath Setup for RH Thermodilution C.O. Measurements
- Setting the Computation Constant
- Performing RH C.O. Measurements
- 1 Enter the procedure window.
- 2 When you see the message Ready for new measurement, select the pop-up key Start C.O.. If the measuring mode is set to Auto the Start C.O. key will also enable the automatic start of consecutive measurements.
- 3 When you hear a ready tone and see the message Inject now!, inject the solution into the right atrial port of the Swan-Ganz catheter. The optimal injection rate is 2.5 ml/second.
- 4 When you see the Inject now! message, repeat the procedure until you have completed the measurements you want to perform. You can perform a maximum of six measurements before editing. If you perform more than six measurements without rejecting any,...
- Editing and Saving RH C.O. Measurements
- 1 Review the trials. Irregular trials or trials marked with a "?" should be reviewed carefully. Consider the similarity of the values and the shape of the C.O. curve. A normal C.O. curve has one smooth peak and returns to the temperature baseline lev...
- 2 Reject unsatisfactory trials: use the Select Trial pop-up key to move between trials, then select the Accept Reject pop-up key to accept or reject trials. If you are using a touch screen you can accept or reject trials directly by tipping on the tr...
- 3 Save average C.O. values. To close a measurement series, you must save the average values by selecting the pop-up key Save C.O.. This sends the average C.O. numeric to be displayed on the main screen, and stores the averaged values in the trends an...
- Setting up RH C.O. Measurements
- Documenting C.O. Measurements
- C.O. Injectate Guidelines
- C.O./CCO Curve Alert Messages
- C.O./CCO Prompt Messages
- C.O./CCO Warning Messages
- C.O./CCO Safety Information
- Monitoring Carbon Dioxide
- WARNING
- WARNING
- Measurement Principles
- Measuring CO2 using M3014A or X2
- WARNING
- CAUTION
- Preparing to Measure Mainstream CO2
- 1 Attach the sensor connector to the CO2 connector on the MMS extension, or on the X2 (when the optional CO2 measurement is integrated).
- 2 Wait 2 minutes, allowing the sensor to reach its operating temperature and a stable thermal condition.
- 3 Choose the appropriate airway adapter and connect it to the sensor head. The airway adapter clicks into place when seated correctly. To zero the sensor:
- 4 Install the airway adapter at the proximal end of the circuit between the elbow and the ventilator Y- section.
- WARNING
- Preparing to Measure Sidestream CO2
- 1 Plug the sensor cable into the monitor's CO2 input connector. Allow the sensor two minutes warm up time
- 2 Connect the cannula, airway adapter, or sample line as appropriate, to the sensor. It will click into place when seated correctly.
- 3 To zero the sensor:
- 4 For intubated patients requiring an airway adapter: Install the airway adapter at the proximal end of the circuit between the elbow and the ventilator Y-section.
- WARNING
- CAUTION
- Using the Sidestream Sensor Holder
- Removing Exhaust Gases from the System
- Measuring Mainstream CO2 using M3016A
- WARNING
- Preparing to Measure Mainstream CO2
- Checking Transducer Accuracy
- WARNING
- 1 In Setup CO₂ menu, select Cal. Mode to switch on calibration mode.
- 2 Look at the calibration value displayed in the Setup CO₂ menu next to Start CAL1. Is it the same as the value on the calstick? If not, calibrate the transducer now.
- 3 Place the transducer on the low cell of the calstick (labeled 0.0 mmHg or "ZERO"). The reading on the screen should be zero within ±1 mmHg within one minute.
- 4 Place the transducer on the high cell of the calstick. The reading on the screen should be within ±1 mmHg of the value on the calstick within one minute.
- 5 If both readings are in range, you can leave calibration mode and begin monitoring. If either of the readings is out of range, calibrate the transducer.
- WARNING
- Calibrating the Transducer
- 1 Check that the windows on the calstick are clean and clear.
- 2 Place the transducer on one of the calstick cells and select Start CAL1.
- 3 Enter the calibration value printed on the calstick then press Confirm to start calibration.
- 4 When the message CO₂ CAL1 calibration done -- Start CAL2 calibration appears, put the transducer on the other cell and select Start CAL2 then press Confirm.
- 5 When you see the message CO₂ calibration completed - leave Cal. Mode, calibration is complete.
- 6 Select Cal. Mode to switch calibration mode off. You cannot monitor in calibration mode.
- Attaching and Removing the CO2 Transducer
- 1 Open the latch and place the transducer (B) onto the airway adapter (A). Place the airway adapter in the patient's breathing circuit between the endotracheal tube and the Y-piece. You may see the CO₂ SENS.WARMUP message until the transducer reach...
- 2 To remove the transducer from the airway adapter, open the latch and pull out the airway adapter.
- WARNING
- Measuring Microstream CO2 using M3015A/B
- Setting up all CO2 Measurements
- Monitoring Airway Flow, Volume and Pressure
- WARNING
- Attaching the Flow Sensor
- CAUTION
- 1 Select the appropriate flow sensor. Make sure that you are using the correct sensor for the respective patient category. Otherwise accuracy may be reduced.
- 1 If you are using a combined CO2/Flow sensor, connect it to the CO2 sensor head first. The airway adapter clicks into place when seated correctly.
- 2 Click the connector into place in the flow sensor receptacle on the monitor before connecting to the breathing circuit.
- 3 Install the flow sensor or the combined CO2/Flow sensor at the proximal end of the breathing circuit between the elbow and the ventilator Y-piece. Make sure that the spirometry sensor is in a horizontal position with its tubing pointing upwards. Th...
- WARNING
- NOTE
- CAUTION
- Zero Calibration
- Automatic Purging
- Manual Purging
- Gas Compensation
- Setting up Spirometry
- Monitoring tcGas
- Identifying tcGas Module Components
- Setting the tcGas Sensor Temperature
- Using the tcGas Site Timer
- Setting the tcGas Barometric Pressure
- Remembraning the tcGas Transducer
- Calibrating the tcGas Transducer
- 1 Connect the calibration unit to the inlet on the side of the module's calibration chamber using the recommended gas tubing. Different tubing will cause inaccurate measurements.
- 2 Plug the transducer cable into the module. Swing the calibration chamber cover open and insert the transducer into the chamber. Close the cover to secure the transducer. Set the transducer temperature at the monitor now.
- 3 On the 15210B calibration unit, turn the timer control clockwise as far as you can. On the Radiometer calibration unit, press the button with the green arrow once.
- 4 Press CAL on the module until the light above the key comes on and wait (three - 20 minutes) for the completion message to appear on the monitor. Alternatively, in the Setup tcGas menu, select StartCalibration. To save gas on 15210B, if the timer c...
- Calibration Failure
- Troubleshooting tcGas Calibration
- 1 Check the calibration unit, then recalibrate, remembering to turn on the gas supply on the calibration unit. If the pressure indicator reading is in the out of gas zone, there is insufficient gas in the cylinder. Connect the gas tubing firmly to th...
- 2 If Step 1 fails, check whether you need to activate the transducer (necessary if the electrolyte has dried out or if you have a new transducer). Remembrane the transducer, removing the old membranes, and cleaning the transducer head thoroughly.
- 3 Calibrate a second time.
- 4 If Step 2 is unsuccessful, calibrate again. This calibration may be required to stabilize the electrochemical system in the transducer.
- 5 Only if the above steps are unsuccessful (you have activated and remembraned the transducer and calibration has still failed twice), replace the transducer.
- Applying the tcGas Transducer
- 1 Peel protection film from fixation ring. Using a finger, press the sticky side of the ring on to clean, dry skin. Press around the outside to ensure a good seal. Apply three to five drops of contact fluid in the ring's center. Remove transducer fro...
- 2 Align the arrow on the transducer with the tab on the ring and fasten by turning a quarter-turn clockwise. Wait 10-20 minutes for readings to stabilize.
- 3 Apply the transducer as soon as possible after you see the message indicating that calibration is complete. If you wait longer than 30 minutes, the heat supply to the transducer switches off to prevent the electrolyte from drying out and a new cali...
- WARNING
- CAUTION
- Selecting the tcGas HeatPowerDisplay Mode
- Zeroing the tcGas Relative Heat Power
- Finishing tcGas Monitoring
- TcGas Corrections
- Monitoring Intravascular Oxygen Saturation
- WARNING
- CAUTION
- Selecting a Measurement Label
- Preparing to Monitor with the M1021A Wide Module
- 1 Optical module
- 2 Balloon inflation stopcock
- 3 Hospira fiber optic catheter
- 4 Optical reference
- 5 Enter setup/calibration
- Carrying out a Pre-insertion Calibration
- WARNING
- 1 Remove outer wrapping from catheter tray to uncover optical connector.
- 2 Place the optical module on the catheter tray in the space provided and open the lid.
- 3 Place the optical connector into the optical module (with the label "TOP" facing upwards) and close the lid.
- 4 In the Setup
menu, select Start Pre-InsCal. Ensure that the tip of the catheter is still in the optical reference. - 5 Insert the catheter when you see the message
calibration completed - catheter ready for insertion. If the calibration fails, repeat the calibration before inserting the catheter. If it fails a second time, replace the optical module.
- WARNING
- Inserting the Catheter
- Performing a Light Intensity Calibration
- Performing In-Vivo Calibration
- Setting Up the In-Vivo Calibration
- Making the In-Vivo Calibration
- 1 Be prepared to draw a blood sample from the patient.
- 2 In the Setup
menu, select Start In-VivoCal. - 3 To clear the distal lumen, draw off and discard at least 2 ml of blood before taking the sample.
- 4 Draw a blood sample from the distal port of the catheter and flush the line according to standard hospital practice.
- 5 Obtain laboratory analysis of the sample using direct measurements.
- 6 Select CalibrationValue and select from the list the value received from the lab.
- 7 Complete the calibration by selecting Store In-VivoCal (even if the stored calibration value did not change) and select Confirm. This updates the data stored in the optical module.
- Setting Up the In-Vivo Calibration
- Making the In-Vivo Calibration
- 1 Be prepared to draw a blood sample from the patient.
- 2 In the Setup
menu, select Start In-VivoCal. - 3 To clear the distal lumen, draw off and discard at least 2 ml of blood before taking the sample.
- 4 Draw a blood sample from the distal port of the catheter and flush the line according to standard hospital practice.
- 5 Obtain laboratory analysis of the sample using direct measurements.
- 6 Select CalibrationValue and select from the list the value received from the lab.
- 7 Select Hct [%] (or Hb [mmol/l] or Hb [g/dl] depending on the set up) and enter the corresponding value from the laboratory analysis.
- 8 Complete the calibration by selecting Store In-VivoCal (even if the stored calibration value did not change) and select Confirm. This updates the data stored in the optical module.
- Changing the Lab Value Required for Entry
- Preparing to Monitor with the M1011A Narrow Module
- Connecting the Optical Module
- 1 Connect the optical module to the SO2 module. Allow the optical module to warm up before you insert the probe/catheter and perform a calibration.
- 2 Position the optical module to avoid contact with liquids. Fluid entering the catheter-optical module connection will impair measurement performance.
- 3 Place the optical module on the catheter tray in the space provided and open the lid.
- 4 For instructions on the placement of fiber optic catheters/probes, refer to the documentation provided with the accessory.
- After Insertion
- Performing In-Vivo Calibration
- Connecting the Optical Module
- Further Information for Both Modules
- Monitoring EEG
- EEG Monitoring Setup
- 1 Plug the trunk cable into the EEG module.
- 2 Prepare the patient's skin prior to placing the electrodes. Good electrode-to-skin contact is important for a good EEG signal, as the skin is a poor conductor of electricity.
- 3 Select the desired electrode montage in the Setup EEG menu or in the EEG Impedance / Montage window.
- 4 Attach the reference electrode first.
- 5 Place the electrodes on the patient's head according to the selected montage. Use electrode gel if you are not using pre-gelled electrodes. Remember to select a site where the signal will not be interfered with by muscle artifacts.
- 6 Connect the electrode connector end to the trunk cable.
- 7 Check the electrode-to-skin impedance in the EEG Impedance / Montage window.
- 8 For good signal quality, keep all lead wires together and away from other electric devices and metallic bodies.
- Using the EEG Impedance/Montage Window
- About Compressed Spectral Arrays (CSA)
- Changing EEG Settings
- EEG Reports
- EEG Safety Information
- EEG and Electrical Interference
- EEG Monitoring Setup
- Monitoring BIS
- BIS Monitoring Setup
- Monitoring BIS Using the DSC and BIS Engine
- 1 BIS Engine Cable
- 2 BIS Module
- 3 Aspect BIS Engine 185-0111
- 4 Aspect Digital Signal Converter 185-0124
- 5 Aspect Patient Interface Cable 186-0131
- 6 Aspect BIS Sensor
- 1 If you are monitoring BIS with the DSC and BIS engine,
- a. Connect the BIS engine to the BIS module using the BIS Engine Cable.
- b. Connect the digital signal converter (DSC) to the digital signal converter port on the front of the BIS Engine. Use the attachment clip to secure the digital signal converter near, but not above the patient's head.
- c. Attach the patient interface cable (PIC) to the digital signal converter (DSC).
- 2 Attach the BIS sensor to the patient following the instructions supplied with the sensor.
- 3 Connect the BIS sensor to the patient interface cable.
- Monitoring BIS using the BISx
- Manufacturer's Information
- Monitoring BIS Using the DSC and BIS Engine
- BIS Continuous Impedance Check
- BIS Cyclic Impedance Check
- BIS Window
- Changing the BIS Smoothing Rate
- Switching BIS and Individual Numerics On and Off
- Changing the Scale of the EEG Wave
- Switching BIS Filters On or Off
- BIS Safety Information
- BIS Monitoring Setup
- Assigning a Telemetry Device and a Monitor to One Patient
- How Can You Combine Devices?
- Functions Available When the Telemetry Data Window is Displayed
- General Telemetry-related Functions
- Use Models With Telemetry
- 1 The monitor is paired with a telemetry transceiver - indirect connection
- 2 An MP5 or X2 is declared as a telemetry device and paired with an MX800 monitor - direct or indirect connection
- 3 A telemetry transceiver directly connected (SRR or for MP5 cable) to an MP5 or X2, that is connected (Companion Mode) to an MX800 monitor - direct connection.
- Trends
- Viewing Trends
- Setting Up Trends
- Making Segment Settings
- Trend Groups
- 1 Select Main Setup, Trends, then Trend Groups.
- 2 Select the Trend Group you want to change and use the pop-up keys to Add, Change, or Delete the selection of measurements trended.
- 1 Select Main Setup, Trends, then Trend Groups.
- 2 Select the Trend Group and then the measurement you want to move and use the Sort Up/Sort Down pop-up keys.
- Trend Interval
- Trend Priority
- Trend Parameter Scales
- 1 In the Main Setup menu, select Trends.
- 2 Select Parameter Scales.
- 3 Select the measurement or parameter you want to change from the list.
- 4 Select the pop-up key Change to call up the Scale menu.
- 5 In the Scale menu, select the parameter label you want to define settings for. Select Adult, Pedi, and Neo and use the pop-up keypad to enter new upper and lower scale definitions.
- Graphical Trend Presentation
- Defining the Column Interval Using the NBP Measurement
- Setting Measurement and Period for Histograms
- 1 Select Main Setup then select Trends.
- 2 Select Setup Histogram.
- 3 Select Data Source.
- 4 Select either a realtime SpO2 or Trended Data. From the trended data list select the required measurement.
- 1 Select Main Setup then select Trends.
- 2 Select Histogram.
- 3 Select Select Period and select the required time period from the list.
- Documenting Trends
- Trends Databases
- Screen Trends
- Calculations
- Viewing Calculations
- Reviewing Calculations
- Performing Calculations
- 1 Select the Calcs SmartKey to open the Calculations window.
- 2 Check the calculation time in the Calc Time field.
- 3 Enter any values that must be entered or edited manually. Select the value field and then use the pop-up keypad to enter the required values. Select Enter to confirm each entered value. Manually- entered values are marked with an asterisk (*).
- Entering Values for Calculations
- Documenting Calculations
- High Resolution Trend Waves
- Event Surveillance
- Levels of Event Surveillance
- Event Groups
- Event Episodes
- Events Pop-Up Keys
- Event Triggers
- If You Use Alarm Limits As Event Triggers
- If You Set User-defined Threshold Triggers
- If You Set "On Measurement" Triggers
- If You Set Use-defined Deviation Triggers
- Event Retriggering
- Event Notification
- Setting Triggers for NER and Basic Event Surveillance
- 1 Group Name
- 2 Episode Type
- 3 Measurements used as event triggers
- 1 Select Main Setup then Event Surveill. followed by Setup Events to enter the Event Setup window.
- 2 Select the name of the current episode type to set the episode pre/post time.
- 3 Set the event trigger for each measurement. Select each trigger name and select, if available, either an alarm trigger, or a user-defined trigger from the pop-up trigger list. If you select a user-defined trigger, set the required threshold level a...
- 4 Set the trigger status to Activated to start event triggering. If the status is Deactivated event surveillance is effectively switched off.
- 5 Select Confirm to confirm your changes.
- Setting Triggers and Notification for Advanced Event Surveillance
- 1 Group Name
- 2 Group Type
- 3 Notification Type
- 4 Episode Type
- 5 Trigger Condition
- 6 Measurements used as event triggers
- 1 Select the group name to enter the setup window for that group.
- 2 Set the trigger status to Activated, to have this event group trigger events, or Deactivated.
- 3 Set the episode type.
- 4 Set the trigger for each measurement. Select each trigger name and select either an alarm trigger or a user-defined trigger from the pop-up trigger list. If you select a user-defined trigger, set the required threshold level and delay time. If a de...
- 5 Select Confirm to confirm your changes.
- Triggering Events Manually
- Running a Car Seat Assessment Record
- The Events Database
- Viewing Events
- Annotating Events
- Documenting Events
- ProtocolWatch
- Recording
- 1 M1116B Plug-in Recorder
- 2 Continue LED - flashes if a continuous recording is ongoing
- 3 RUN/CONT key - starts a delayed recording or makes the current recording continuous
- 4 STOP key - stops the current recording
- Central Recording
- Starting and Stopping Recordings
- Quickstarting Recordings
- Extending Recordings
- Stopping Recordings
- Recording Without a Template
- 1 Either: Select the Recor- dings SmartKey then select the pop-up key Select Waves.
- 2 Use the pop-up keys to choose up to three measurement waves to be printed on the recording. If you want fewer than three waves on the recording, select the waves you want then select the Continue pop-up key.
- 3 Select one of the recording speed pop-up keys to set the required recording speed.
- 4 Select the Start pop-up key to start the recording.
- Overview of Recording Types
- All ECG Waves Recordings
- Creating and Changing Recordings Templates
- 1 Select the Main Setup permanent key to call up the Main Setup menu.
- 2 Select Recordings to enter the Setup Recording menu.
- 3 Select the name of the template you want to create or change. Each recording name is linked to a recording type, delayed, alarm, realtime, and hi-res trends. Recording names can be changed in the monitor's Configuration Mode.
- 4 Design the template by selecting each menu item and entering the information for the template.
- Changing ECG Wave Gain
- Recording Priorities
- Recording Strip
- Reloading Paper
- M1116B
- 1 Use the latch on the right side of the recorder door to pull the door open.
- 2 Remove the empty core.
- 3 Insert a new roll so that it fits snugly into its housing and the paper end is feeding from the top. Recommended paper: 40477A and 40477B.
- 4 Pull out some paper and fold along the front edge at a 45° angle. This makes it easier to feed the paper under the roller as shown.
- 5 Feed the paper through and pull some paper out from the top of the roller.
- 6 Close the recorder door.
- 7 To test if paper is loaded correctly, start a recording. If no printing appears, paper may be loaded backwards. Try reloading the paper.
- M1116B
- Recorder Status Messages
- Printing Patient Reports
- Starting Report Printouts
- Stopping Reports Printouts
- Setting Up Reports
- Setting Up ECG Reports
- 1 Select Main Setup, Reports, then ECG Reports. Note the report layout configured for your monitor, either Internat or Cabrera. This setting is inactive ("grayed-out") in Monitoring Mode and can only be changed in Configuration Mode.
- 2 Select ECG Gain and set the required ECG gain to define how ECG waves will appear on the ECG report printouts.
- 3 Select Speed and select the report print speed.
- 4 Select Annotation and switch to On if the printed ECG wave should be annotated with beat labels. See the chapter on ECG for a list of beat labels. Pace pulse marks are automatically printed beside the wave for paced patients.
- Setting Up Vital Signs and Graphic Trend Reports
- 1 Select Trend Group and select the group you want to print on the report. The groups available depend on your monitor's trend configuration.
- 2 Select Period and select the period of time for which trend data should be printed on the report. If Automatic Period is configured to On, all trend data for the current patient will be printed, irrespective which trend period is selected.
- 3 Select Interval (Vital Signs Reports only) and select the resolution of the trend data printed on the report,
- Setting Up Auto Reports
- 1 Select Main Setup, Reports, then Auto Reports and select the Auto Report you want to set up (A, B, C, or D).
- 2 Select Report and assign a report type to the Auto Report.
- 3 Select End Case Report and switch to On if you want the selected report to print automatically when you select End Case to discharge a patient.
- 4 Select Scheduled Rep. and toggle to On if you want the selected report to print at predefined intervals, starting at a predefined time of day. The start time you set applies for every following day. For example, if you set a start time of 07:00 and...
- 5 Repeat the procedure for all Auto Reports you want to set up.
- Setting Up ECG Reports
- Setting Up Individual Print Jobs
- 1 Select Report and then select the report you want to set up.
- 2 Select Report Type and then select the reports template you want the report selected in Step 2 to use. The selection of templates listed depends on the report type selected.
- 3 Select Report Size to set the paper size to be used for the report: Unspecified to use the default size for the template chosen, Universal, A4, Letter, LrgUniversal, A3, or Ledger. The list of available sizes depends on the report type selected.
- 4 Select Orientation to set the orientation of the report printout: Unspecified to use the default size for the template chosen, Landscape or Portrait.
- 5 Select Target Device and choose which printer the print job will be sent to: Unspecified to use the default printer, or choose from the list of printer names defined at the Information Center or in the monitor's Configuration Mode (for example, Rem...
- Checking Printer Settings
- Printing a Test Report
- Switching Printers On Or Off for Reports
- 1 In the Setup Printers menu, select Printer and then select the name of the device you want to switch on or off for Reports printing from the pop-up list.
- 2 Select Printer Status to toggle between the settings Enabled and Disabled. If you set this to Disabled, no reports will be printed to the named printer.
- Dashed Lines on Reports
- Unavailable Printer: Re-routing Reports
- Checking Report Status and Printing Manually
- Printer Status Messages
- Sample Report Printouts
- Using the Drug Calculator
- WARNING
- Accessing the Drug Calculator
- Performing Drug Calculations
- About the Rule of Six
- Performing Calculations for a Non-Specific Drug
- 1 Enter three of these four values: dose, amount, volume, and rate of the infusion solution.
- 2 If you have chosen a weight-dependent dose unit, you must enter the patient weight now or choose a different unit.
- 3 When you have entered three values, the Drug Calculator automatically calculates the unknown fourth value and shows it in the highlighted field. Standardized rate and concentration are also calculated.
- Performing Calculations for a Specific Drug
- 1 Select the arrow beside ANY DRUG, then select the required drug from the list of drugs.
- 2 Select the correct patient category for your patient.
- 3 Enter the patient weight, if necessary.
- 4 When a specific drug is selected, the initial values for Dose, Amount and Volume are the configured Start values for this drug. The Rate is then calculated. If other values are required you can calculate any value by entering the remaining three va...
- Charting Infusion Progress
- Using the Titration Table
- Documenting Drug Calculations
- IntelliBridge EC10 Module
- 1 module name
- 2 setup indicator LED
- 3 setup/data viewing key
- 4 connection status LED
- 5 external device cable connector
- Connecting an External Device
- 1 Insert the module into the FMS or integrated module slot.
- 2 Check that you have the correct EC5 ID module for the external device - indicated on the EC5 label.
- 3 Connect the EC5 ID module to the external device.
- 4 Connect the EC5 to the EC10 module using the supplied cable.
- 5 Switch the external device on.
- 6 The connection status LED (4) will flash green until it has correctly identified the external device and started communication. Check that the connection status LED then lights green continuously indicating that communication has been established.
- Changing Waves and Numerics Displayed
- Viewing the IntelliBridge Device Data Window
- Using Screens with External Device Data
- Alarms/INOPs from External Devices
- Language Conflict with External Device Drivers
- VueLink Modules
- 1 module name
- 2 device label
- 3 selection LED
- 4 setup key
- 5 external device cable connector
- 6 setup indicator LED
- 7 module type (A or B)
- Connecting an External Device
- 1 Insert the module into the FMS or integrated module slot.
- 2 Check that the device selection LED (3) lights to show that it has correctly identified the external device. If not, select Main Setup, Measurements and then the name of the external device to enter the setup menu for the connected device.
- 3 In the device setup menu, select Device, select the correct device from the list, and confirm the selection.
- 4 Connect the external device to the module and switch it on.
- CAUTION
- Changing VueLink Waves and Numerics Displayed
- Viewing the VueLink Device Data Window
- Using VueLink Screens
- Switching VueLink On and Off
- Alarms/INOPs From External Devices
- Language Conflict with External Device Drivers
- Using Timers
- Respiratory Loops
- Laboratory Data
- Care and Cleaning
- General Points
- Cleaning the Monitor
- Disinfecting the Monitor
- Sterilizing the Monitor
- Cleaning, Sterilizing and Disinfecting Monitoring Accessories
- Cleaning the SO2 Optical Module
- Cleaning the Recorder Printhead (M1116B only)
- 1 Remove the recorder.
- 2 Open the recorder door and un-thread the paper from behind the rubber roller.
- 3 Tear off or roll up the excess paper into the roll chamber to get it out of your way.
- 4 Thread the cloth cleaning strip instead of paper around the rubber roller until approximately two inches of the strip come out from the top of the roller.
- 5 Close the recorder door, aligning both ends of the strip over the top of the door.
- 6 Holding the top end of the cleaning strip between your thumb and forefinger, pull the strip through and out of the recorder.
- 7 Open the door and ensure that the paper cavity is dust-free. Re-thread the paper and replace the recorder.
- Maintenance and Troubleshooting
- WARNING
- Inspecting the Equipment and Accessories
- 1 Examine unit exteriors for cleanliness and general physical condition. Make sure that the housings are not cracked or broken, that everything is present, that there are no spilled liquids and that there are no signs of abuse.
- 2 Inspect all accessories (cables, transducers, sensors and so forth). If any show signs of damage, do not use.
- 3 Switch the monitor on and make sure the backlight is bright enough. Check that screen is at its full brightness. If the brightness is not adequate, contact your service personnel or your supplier.
- 4 If the MMS and MMS Extensions are mounted on the monitor, make sure that they are locked into place and do not slide out without releasing the locking mechanism.
- WARNING
- Inspecting the Cables and Cords
- 1 Examine all system cables, the power plug and cord for damage. Make sure that the prongs of the plug do not move in the casing. If damaged, replace it with an appropriate Philips power cord.
- 2 Inspect the Measurement Link cable and ensure that it makes good connection with the MMS and the FMS. Make sure that there are no breaks in the insulation.
- 3 Inspect the cable connecting the MMS to the monitor. Make sure the connectors are properly engaged.
- 4 Inspect the patient cables, leads and their strain reliefs for general condition. Make sure there are no breaks in the insulation. Make sure that the connectors are properly engaged at each end to prevent rotation or other strain.
- 5 Apply the transducer or electrodes to the patient, and with the monitor switched on, flex the patient cables near each end to make sure that there are no intermittent faults.
- Maintenance Task and Test Schedule
- Troubleshooting
- Disposing of the Monitor
- Disposing of Empty Calibration Gas Cylinders
- 1 Empty the cylinder completely by pushing in the pin of the regulator valve or by pulling out the pin of the fill valve using a tire valve stem wrench or a pair of needle nose pliers.
- 2 When the cylinder is empty, either remove the valve stem from the fill (or regulator) hole, or drill a hole in the cylinder.
- 3 Write "Empty" on the cylinder and dispose of it appropriately for scrap metal.
- WARNING
- Accessories
- WARNING
- ECG/Resp Accessories
- NBP Accessories
- Invasive Pressure Accessories
- SpO2 Accessories
- Temperature Accessories
- Cardiac Output (C.O.) Accessories
- Mainstream CO2 Accessories
- Sidestream CO2 Accessories
- Mainstream CO2 Accessories (for M3016A)
- Microstream CO2 Accessories
- Spirometry Accessories
- tcGas Accessories
- EEG Accessories
- BIS Accessories
- SO2 Accessories for M1021A
- SO2 Accessories for M1011A
- Recorder Accessories
- Battery Accessories
- Specifications
- Intended Use
- Manufacturer's Information
- Symbols
- Installation Safety Information
- Monitor Mounting Precautions
- Altitude Setting
- Monitor Safety Specifications
- EMC And Radio Regulatory Compliance
- Physical Specifications
- Environmental Specifications
- Performance Specifications
- Interface Specifications
- Measurement Specifications
- Safety and Performance Tests
- Default Settings Appendix
- Country-Specific Default Settings
- Alarm and Measurement Default Settings
- Alarm Default Settings
- ECG, Arrhythmia, ST and QT Default Settings
- Pulse Default Settings
- Respiration Default Settings
- SpO2 Default Settings
- NBP Default Settings
- Temperature Default Settings
- Invasive Pressure Default Settings
- Cardiac Output Default Settings
- CO2 Default Settings
- Spirometry Default Settings
- tcGas Default Settings
- SO2 Default Settings
- SvO2 Default Settings
- ScvO2 Default Settings
- EEG Default Settings
- BIS Default Settings
- VueLink Default Settings

5 ECG, Arrhythmia, ST and QT Monitoring
145
If a lead is in INOP (the value is being measured but is invalid or unavailable because, for example, the
corresponding ECG electrode is off), the area formed by the remaining ST leads is left open.
If there is insufficient information (for example, there are less than three chest leads) for a second ST
map to be displayed, the currently available ST values are displayed in place of the second ST map.
Trend View
In trend view, you can see up to four trended ST maps, and the current ST map, simultaneously. You
can configure the time interval between trended samples. The most recent map is shown in the same
color as the parameter itself. Past values change from white through dark gray. In the diagram below,
the time interval between trends is 12 seconds. The first trended sample is white and is 12 seconds old.
The second trended sample corresponds to the ST values 24 seconds ago and so forth. The ST values
on the diagrams show the current ST values.
If a lead is turned off, its axis is no longer shown. This has no impact on the presentation of trended
values that were recorded while the lead was still on. In the diagram below, lead V4 was switched off
20 seconds ago. The current ST values and the first trended value reflect this change in the lead setup.
All other maps are displayed the way in which they were recorded.
1 Limb Leads
2 Chest Leads
3 current ST values
4 trending interval