
Software Owner manual


windows, the graph displays changes in the maximum, average, and minimum I/O rates in
one minute.
Performance Control applies upper limits and thresholds to the average I/O rate or the average
transfer rate calculated every gathering interval. For example, in the following figures in which
the gathering interval is 1 minute, if you set an upper limit of 150 I/Os to the port 1A, the
highest data point in the line CL1-A in Graph 2 and the line Ave.(1 min) in Graph 3 is
somewhere around 150 I/Os. It is possible that the lines Max (1 min.) and Min (1 min.) in
Graph 3 might exceed the upper limit.
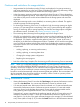
Figure 3 Graph 1: actual I/O rate (measured every second)
Figure 4 Graph 2: I/O rate displayed in Performance Monitor (the Detail check box is not
selected)
Figure 5 Graph 3: I/O rate displayed in Performance Monitor (the Detail check box is selected)
Using Performance Control 19