
Web Tools User's Guide (Version 3.0)


Web Tools User’s Guide 1-3
Introducing Web Tools
1
When monitoring and managing individual ports, Web Tools allows you to perform the following
functions:
Web Tools Main Views
Web Tools provides access to and information about the fabric through a number of separate
windows, called “views”, making it possible to manage and monitor several aspects of the fabric at
the same time.
The main views available through Web Tools are:
1. Fabric View
2. Switch View
3. Port Information View
View the port status. See PortStats Tab on page 5-3.
View information about GBIC (Gigabit
Interface Converter) Serial IDs.
See GBIC Tab on page 5-5.
View and manage loop information. See Loop Tab on page 5-8, QuickLoop Tab
on page 4-50, or The Name Server Table
also includes the following columns: on
page 3-10.
View port performance, including frame counts
(frames in, frames out) and error counts.
See Current Settings tab in the Fabric
Watch View on page 4-17.
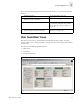
Initial Display Upon Launching Web Tools: Fabric View
Figure 1-1 Fabric View