
11.0 HP StoreVirtual Storage User Guide (AX696-96275, December 2013)


When the management group is created, check the Best Practice Summary to verify that the
configuration is following best practices for availability and data protection. See “Best Practice
summary overview” (page 109).
Logging in to a management group
You must manually log in to a management group. After you have logged in to one management
group, the CMC attempts to use the credentials from the first login when you log in to additional
management groups.
CAUTION: Do not log in to the same management group from more than one CMC.
Management group map view tab
After you create the management group and finish setting up the SAN, use the Map View tab for
viewing the relationships between servers, sites, clusters, volumes, snapshots, and remote copies
in the management group. For more information on using the map view tools, see “Using the Map
View” (page 10).
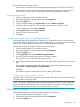
Configuration Summary overview
The Configuration Summary provides a reference for managing the size and optimum configuration
of your SAN. A Configuration Summary is created when the first management group is created
Figure 53 (page 107). Select Configuration Summary in the navigation window to view it. Subsequent
management groups are added to the Configuration Summary. For each management group, the
Configuration Summary displays an overview of the volumes and snapshots, iSCSI sessions, and
storage systems in the management group and in clusters, and provides guidance for the optimal
configuration.
NOTE: You can also view the Configuration Summary in the Configuration Summary pane on
the SAN Status Page.
Figure 53 Configuration Summary
Reading the configuration summary
As items are added to the management group, the Summary graph fills in and the count is displayed
in the graph. The Summary graph fills in proportionally to the optimum number for that item in a
management group, as described in “Configuration guidance” (page 109).
Optimal configurations
Optimal configurations are indicated in green. For example, in Figure 54 (page 108), there are 15
storage systems in the management group “CJS1.” Those 15 storage systems are divided among
the clusters “c” “c2” and “c3.” The length of the graph is relative to the recommended maximums
in each category. For example, 3 storage systems in cluster c3 are closer to the cluster recommended
Configuration Summary overview 107