
HP 3PAR System Reporter 3.1.0 Software User's Guide (QL226-96645, December 2012)


• Vert Bars
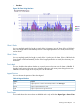
Figure 39 Chart Using Vert Bars
Chart X Pixels
You can explicitly specify the length in pixels of the X (category) axis of charts. If this is left blank
the X axis length will be automatically chosen. If the length specified is too small, the chart may
not be drawn.
Chart Y Pixels
You can explicitly specify the length in pixels of the Y (value) axis of charts. If this is left blank the
Y-axis length will be automatically chosen. If the length specified is too small, the chart may not
be drawn.
Time Labels
This is a checkbox that selects whether or not each point on the time axis of charts is labelled. If
checked, each point on the time axis is labelled, otherwise only some points along the axis are
labelled so that the length of the X (time) axis can be reduced.
Legend Position
You can choose the position of the chart legend.
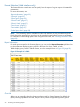
Table 40 Legend Position
PurposeOption
Legend position is chosen automatically based on the Chart Type.Auto
Legend is placed below the chart.Bottom
Legend is placed to the right of the chart.Right
Time Format
This control selects how time values are labelled and is only valid when Report Type is Versus Time.
Creating Custom Reports 97