
User manual


Copyright © 2003-2010 Eagle Tree Systems, LLC
Page 12
After operating your model with the eLogger, connect the eLogger to USB and download the data.
After you connect the eLogger to your PC’s USB interface, the LED should indicate USB connectivity with three repeating flashes as
described above.
Once the eLogger is connected, launch the Software and click on the “Download” button in the “Recorder Data Operations” section
of the main screen. This will load the eLogger’s memory buffer into the Software for playback and saving.
Use the play controls to play back the data. Note that the Slider can be dragged with the mouse by clicking and holding it then
moving it to the desired position.
The software can display the following information:
• Notifications – this window displays messages about the recording. The three most common messages are:
o Startup/Reset Detected – this indicates that the eLogger has been turned on at the time specified
o eLogger low battery restart – this indicates that the eLogger has ‘rebooted’ because the power momentarily dropped
below around 4.5 volts. See the troubleshooting section if you frequently see this message.
• Length/Progress – when stopped, this readout indicates the total recording length. When playing back, this meter indicates
current time into the session.
• Graphical and/or Numeric Pack Voltage – The software displays the current or max (when playback is stopped) pack
voltage readings in either gauge or numeric format.
• Graphical and/or Numeric Pack Current – The software displays the current or max pack amperage readings in either
gauge or numeric format.
• Pack Wattage – this gauge indicates the pack wattage during playback.
• Cumulative Amp-Hours – this numeric display indicates the cumulative AH used
• Graphical and/or Numeric Temperatures – The software can display up to two Temperature readings in either gauge or
numeric format.
• Graphical and/or Numeric RPM – The software displays RPM readings in either gauge or numeric format.
• Graphical and/or Numeric Airspeed – The software displays airspeed readings in either gauge or numeric format.
• Graphical and/or Numeric Temperatures – The software displays temperature readings in either gauge or numeric format.
• Graphical and/or Numeric GPS parameters – The software displays GPS speed, course, altitude, and distance from the
operator readings in either gauge or numeric format.
• Graphical and/or Numeric Speed (Cars Only) – The model’s speed, as computed from the RPM, can be displayed
graphically and numerically.
Multiple Session Support
Depending on the length of your modeling sessions, it is often possible to record multiple runs into the eLogger without having to
clear the buffer or overwrite data. The eLogger software will split multiple sessions automatically for you. By clicking the
“Sessions” option in either the playback or graphing pages of the software, you can display a separate session, or all sessions
simultaneously. When graphing all sessions simultaneously, vertical gray bars on the graph indicate where sessions start.
Note that a new session is created in the logger each time it is powered off and on.
Saving eLogger Log Files
After downloading session data, if you wish to save the data to play back later or to share with friends, save the file with the
“File/Save Recorder File” menu. Note that the file is saved with a .FDR extension by default.
Clearing the eLogger’s Memory Buffer
After downloading data, you can clear the eLogger’s memory buffer if desired, to ensure there will be enough space for your next
sessions. To do this, just click the “Clear Recorder”button in the “Recorder Data Operations” section of the main software screen, or
click “Data, Clear Recorder Buffer.”
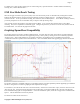
Combining Log Files