
Users Guide

Rearranging or Resizing Graphs and Reports—Components
Click the icon and select from the following options:
• Floating — To move the component freely in the portal page.
• Dockable — To dock the component in the portal page. If the component is oating, right-click the title to dock or tab the
component.
• Tabbed Document — To move the component into a tab in the portal page.
Select the
Figure 10. Docking icon.
control to dock a oating component. You can create a tabbed view by docking a pane within other panes or dock a pane at the top,
bottom, left, or right side of the main window.
You can resize panes and all panes ll the selected area when docked.
To move the component to the side bar, click the
Figure 11. Move icon
icon and to restore it, select the component and click the
Figure 12. Restore icon
icon.
To create lters in a report grid, click the
Figure 13. Filter icon
icon. This is not specic to the portal page layout and the settings related to these associations are not saved.
Filtering Data
You can lter the results by dragging and dropping column headers to the top of reports. You can choose one or more attributes
when revising the view to meet your specic needs.
For example, in Devices by Status pie chart, click a status such as Critical. In the Device Summary page, drag the Device Type and
Service Tag to the top of the report. The view immediately changes to a nested information based on your preference. In this
example, the information is grouped rst by Device Type, and second by Service Tag. Drill-down through these ltered groups to
view the remaining information for the devices.
For more information, see Viewing Device Summary.
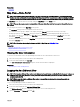
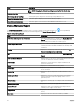
Search Bar
The search bar is displayed at the top-right of the dashboard below the heading banner. The search bar is accessible from all portal
pages, except when a pop-up or wizard is displayed. As you type text in the search bar, matching or similar item are displayed in the
drop-down list.
43