
Software Instruction Manual


IQ–MSD Turbo 1.4 Advanced IQ System Software
Page 110
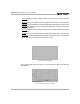
Fig. 4.54 The Plotter Cursor Displays the Value of Each Graph Coordinate
Holding and dragging the pointer over the Plotter object with the left mouse button ({) will cause a cursor to
display the exact value of each coordinate on the graph. This is shown in Figure 4.54 below:
Note: A Plotter object will be automatically created whenever a Curve object is created if no other Plotter objects
are present.
To remove a curve from the graph, drag its label off of the bottom of the Plotter object. This unlinks the Curve object
from the Plotter object.